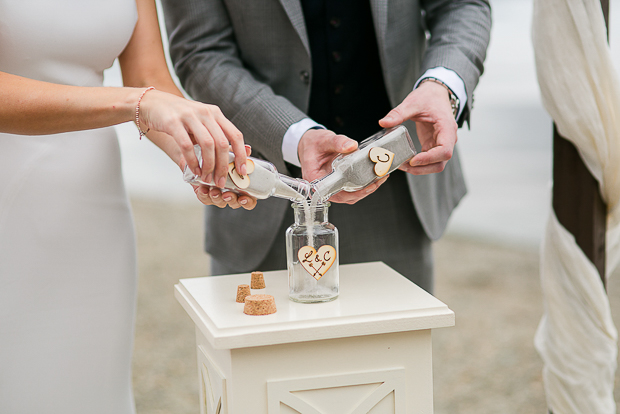
Figures released by the Central Statistics Office over the weekend have given us an insight into the latest Irish wedding trends, and we're actually a little surprised at the results. The average age of an Irish bride and groom is older than we expected, and the popularity Catholic ceremonies had us double-checking the figures! A whopping 22,021 marriages were legalised in Ireland last year, including 759 same-sex marriages, so without further ado, let's take a closer look at the details...
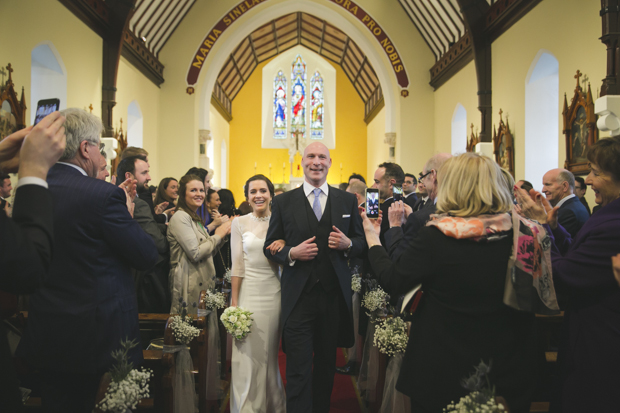
1. Most Weddings in Ireland feature Catholic Ceremonies (but things are changing fast)
Roman Catholic weddings make up an impressive 52.8% of opposite-sex ceremonies, but this number has dropped significantly - it was over 90% in the 1990s. Civil marriage ceremonies were the second most popular choice, accounting for 27.7% of marriages, while other religious ceremonies accounted for a further 6.9%, including Church of Ireland (1.8%) and Presbyterian (0.3%).
2. Humanist and Spiritualist Ceremonies are on the Rise
Alternative ceremonies can't compete with Catholic ones just yet, but they're steadily growing in popularity - humanist ceremonies rose 1% from 6.8% in 2016 to 7.8% in 2017, and spiritualist ceremonies made a leap of .7% from 4.6% in 2016 to 5.3% in 2017.
3. Irish Brides and Grooms are Older than Ever (unless they're in a same-sex relationship!)
The average age of brides and grooms continues to rise to new heights - the average bride in an opposite-sex couple last year was 34.1 years, up from 33.8 the previous year, and her groom 36.1 years, up from 35.7. Same-sex couples are older, but the average age is actually dropping - the average bride in a same-sex couple in 2017 was 40.5, down from 41.0, and the average groom 40.3, down from 40.5.
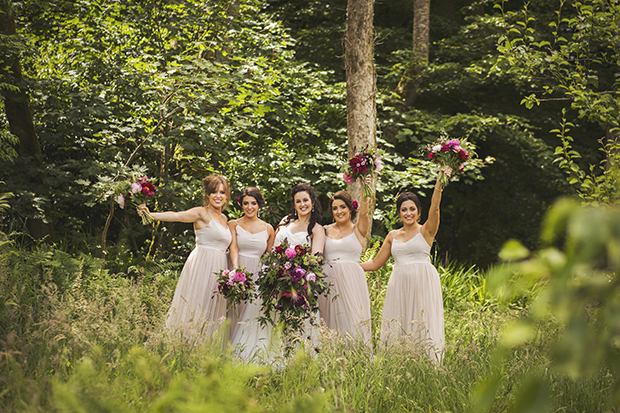
4. Irish Couples Love a Summer Wedding
July and August continue to be the most popular month for opposite-sex weddings, while September topped the list for same-sex weddings. January and February are the least popular, which should come as no surprise given the winter we've had!
5. The Weekend Still Rules
Irish couples prefer to make a weekend of their wedding celebrations - at least, that's what we can deduce from the CSO statistics! Friday and Saturday continue to be the most popular days to get married for opposite-sex couples, while Thursday and Friday are most popular for same-sex couples. Sundays and Mondays remained the least popular days of the week to marry for all couples.
Featured image credit: Aoife O'Sullivan Photography
Still planning your wedding ceremony? Check out our essential guide to ceremony readings and handy downloadable here!

